Chimney maintenance professionals face a persistent challenge: accessing adequate lighting in confined, elevated spaces where traditional power sources prove impractical or hazardous. Off-grid solar LED lighting systems solve this operational bottleneck by delivering reliable, portable illumination without extension cords, generators, or building electrical access—critical advantages when servicing structures like those maintained by masonchimneyrepair.com and similar professional operations.
Solar-powered LED solutions transform chimney inspection and repair efficiency. These systems …
Read More
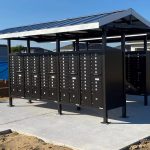
Evaluate solar lighting solutions before making purchase decisions on rural properties, development sites, or estates where grid connection costs exceed £5,000—a threshold where off-grid systems typically deliver faster payback. Property Saviour UK buyers increasingly recognize that commercial-grade solar lighting affects property valuations differently than residential systems, with quality installations adding 2-4% to commercial property values when documented with performance data.
Calculate total cost of ownership rather than upfront pricing alone. A £3,500 solar lighting system …
Read More
LED strip lights are known for their versatility in shaping the ambiance of a space. When applied around a TV, they can effectively transform the atmosphere and create a heightened sense of relaxation and an ideal environment for enjoyable viewing.
By embracing this lighting style, you not only elevate the visual allure of your space but also cultivate a more immersive and pleasurable environment for your entertainment activities.
What is TV Wall Lighting
If you…
Read More
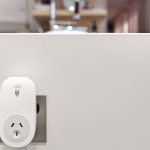
During the daytime, solar panels carry out a remarkable transformation: they convert sunlight into electricity. This phenomenon unfolds as light photons strike the surface of a solar cell, dislodging electrons from the silicon atoms in the cell’s crystalline structure.
The electricity generated from this process is directed through a specialized charge/load controller, which in turn charges the battery…
Read More
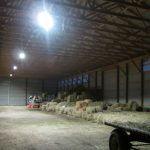
In the pursuit of offering secure and reliable public transportation, transit companies, cities, and municipalities recognize the vital role that proper lighting plays in ensuring passenger comfort and enhancing the overall well-being of the community.
Throughout this article, we will thoroughly examine how solar lighting solutions are uniquely equipped to meet the demands of transit systems.
…
Read More